
Coordinated Low Interest Rate Bubbles And Market Fraud By Central Banks Have Destroyed Western Economies
Gold And Silver Start To Speak

The largest debt bubble in history is now rapidly drawing to a close, but don’t believe that when it happens it was one big unhappy accident or unforeseeable.
The economic sleight of hand to get to this point was carefully and intentionally crafted - and we have the receipts.
Austrian School economists have warned for more than a century that central planners at our central banks attempting to generate economic growth based upon loose monetary policy and credit expansion only drive unsupported consumption, misallocation of capital and the boom-bust cycle and, if continued, lead us inevitably to currency, economic, and social collapse.
In short, increased consumption driven by credit expansion before an increase in economic output leads to misallocation of resources, destabilization of the economy, and goods price inflation from the associated currency inflation.
Don’t think for a second that this stopped our central bankers and politicians who set about blowing bubbles and financing deficits for their owners (not you and me).
The Grift - Loose Money, Fake Gold Prices, Fake Reported Price Inflation
The grift that has brought humanity to the brink of where the world drops off was fairly simple and required the following:
Operate increasingly loose monetary / serial bubble blowing policy globally starting in 1987 with Alan Greenspan taking over the Federal Reserve and coordinate this loose monetary policy globally between central banks through bi-monthly meetings attended by central bank chairmen/governors at the opaque Bank for International Settlements (the ‘central bank for central banks’) in Basel, Switzerland. When the bubbles collapse, bail-out banks with central bank currency creation providing gambling insurance.
Gold and silver stop loose monetary policy when they signal loose central bank monetary policy by running higher in their price inducing bonds to be sold thus driving interest rates higher. In the 1970s, gold ran higher in price by 21x and silver ran 24x higher in price forcing interest to 19% as bonds were sold and terminating loose central bank monetary policy. The solution: in 1987 control of the world’s largest physical gold and silver market in London was given to the Bank of England central bank and trading initiated of promissory notes for gold and silver, that can be created without limit, to price fix (rig) down gold and silver prices with this artificial supply. This was accompanied by off-balance-sheet leasing of central bank gold of an estimated 50 million (M) oz. per year (50% of annual mine supply) to flood the global gold market as reported by fund manager Richard Pomboy in 1996 and a couple of years later central bank consultant Frank Veneroso and analysts James Turk and Reg Howe, all working independently.
Continually restructure price inflation models to incrementally reduce stated price inflation. Use tools such as substitution effects, component re-weightings, hedonic price adjustments, etc. to continually reduce reported price inflation to allow protracted loose monetary policy to be effected. Keep in mind that in 2024 former Treasury Secretary Larry Summers co-authored a paper showing that in recent years actual cost-of-living price inflation ran at twice the BLS published inflation rate (up 18% vs the published 9% p.a. rate published in mid 2022) - more on this later.
The Impact Of The Central Bank And London Gold Grift
With published official inflation rates increasingly reported-down and the price of gold and silver suppressed by banks issuing, and investment funds holding un-backed promissory notes in London’s immediate ownership cash metal market reducing physical gold demand, central bankers were apparently free to have their way with loose monetary policy running interest rates down to zero.
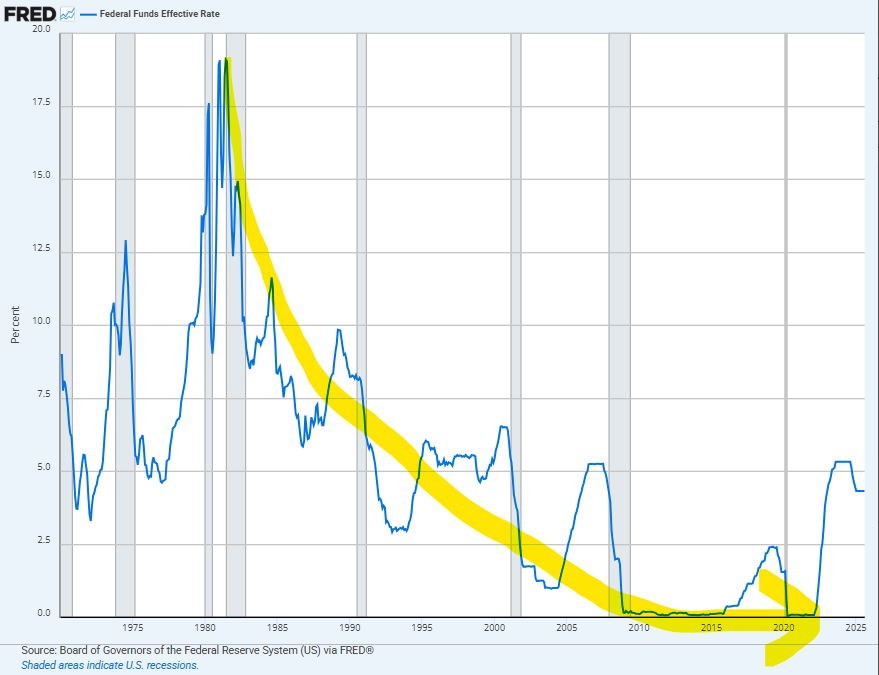
Figure 1 - Fed Funds Effective Interest Rate 1970 - 2025; source: St. Louis Federal Reserve Bank
The central bank loose monetary policy bubble run reflected in these low interest rates had the predictable effect of sending asset (stocks, housing prices, bonds) prices skyward.
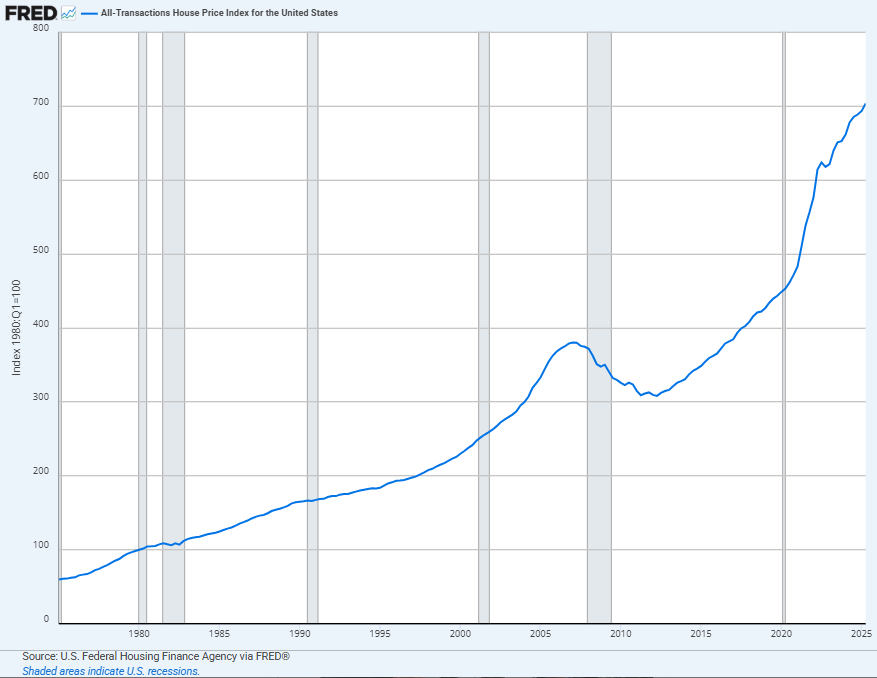
Figure 2 - All US Transaction Home Price Index 1970 - 2025; source: St. Louis Federal Reserve Bank
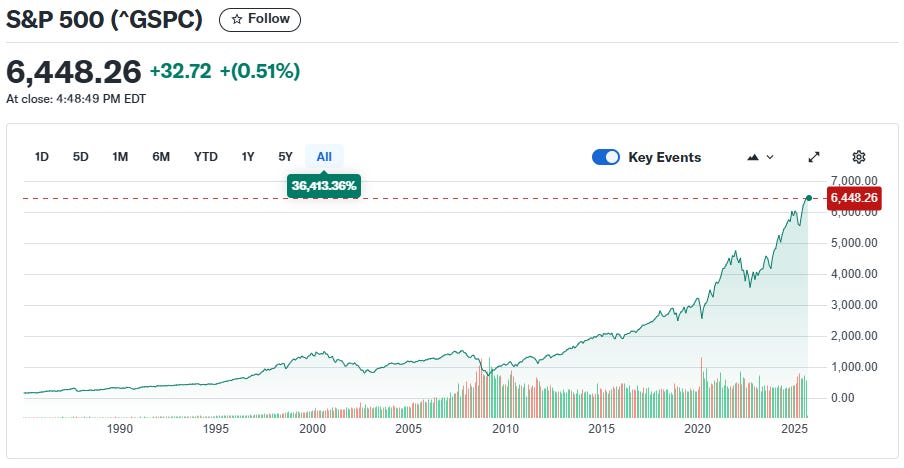
Figure 3 - S&P 500 Stock Index 1985 - 2025; source: yahoo!Finance
Central Bank Majick Now Ends
The false reality created by central banks monetary policy can be seen in the GDP per capita figures once we account for the impact of understated price inflation.
Recall Larry Summers estimating that true cost-of-living inflation calculations were understated by 50%. John Williams is an economist who has been tracking the offical inflation figures for decades. Williams was retained by Boeing in the 1990s to help straighten-out their suddenly failing economic models as the US Bureau of Labor Statistics (BLS) aggressively began to revise-down their official price inflation models.
Williams website shows that a 1990 BLS CPI inflation model carried through to 2025 has continually understated the official CPI-U inflation figures by 3% to 4% for decades.
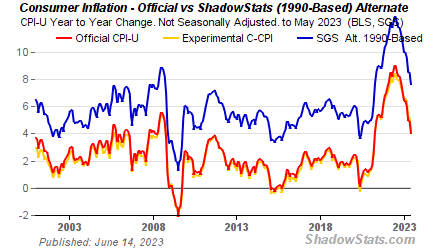
Figure 4 - Comparing Price Inflation Rates - 1990 BLS Model (Blue Line); source: ShadowStats.com
The Fed publishes Real GDP Per Capita data that shows an increase of output per person in the US from $50,000 in 2000 to $69,300 in Q2 2025 for a total real increase (inflation adjusted) of 38.6% over these 25 years.
Let’s consider that real price inflation is understated as stated by Summers and Williams.
If price inflation has been understated annually by just 2% p.a. over the 25 years from 2000 that implies that the real GDP per capita was approximately $42,240 at the end of this period with output per capita 39% lower than stated despite an increase of total US debt of $75.7 trillion (T) during this period.
The economy is thus in fact shrinking in real terms and citizen wealth is declining in real terms masked by their continual borrowing to maintain consumption in the face of rising prices and declining real income.
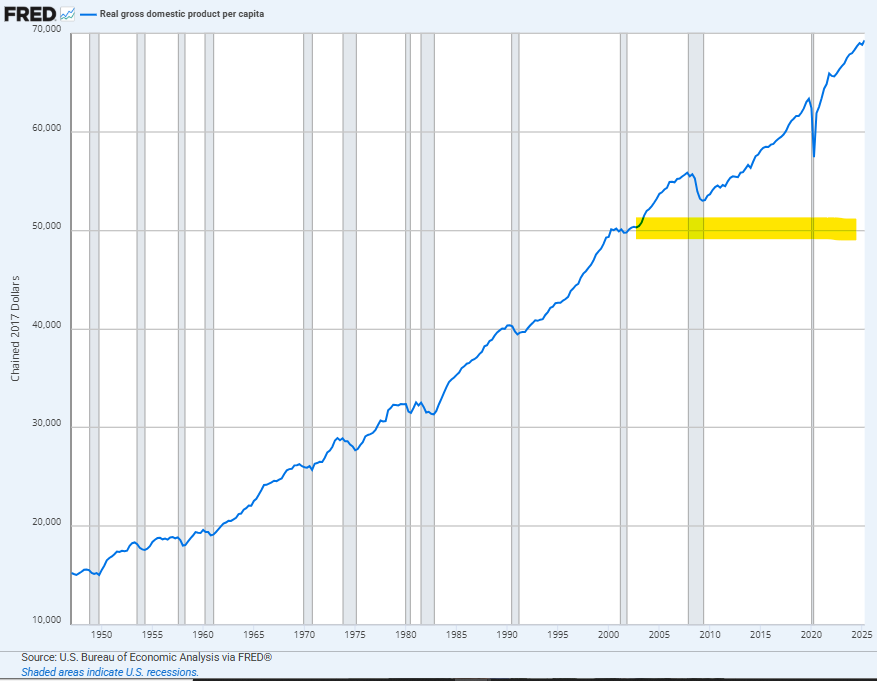
Figure 5 - US Real GDP Per Capita 1950 - 2025; source: St. Louis Federal Reserve Bank
The Bond Market Is Belatedly Calling An End To The Grift
Inflation sensitive 30 year long bond market yields are now aggressively moving higher for France and the UK with the US 30 year yield poised to break higher.
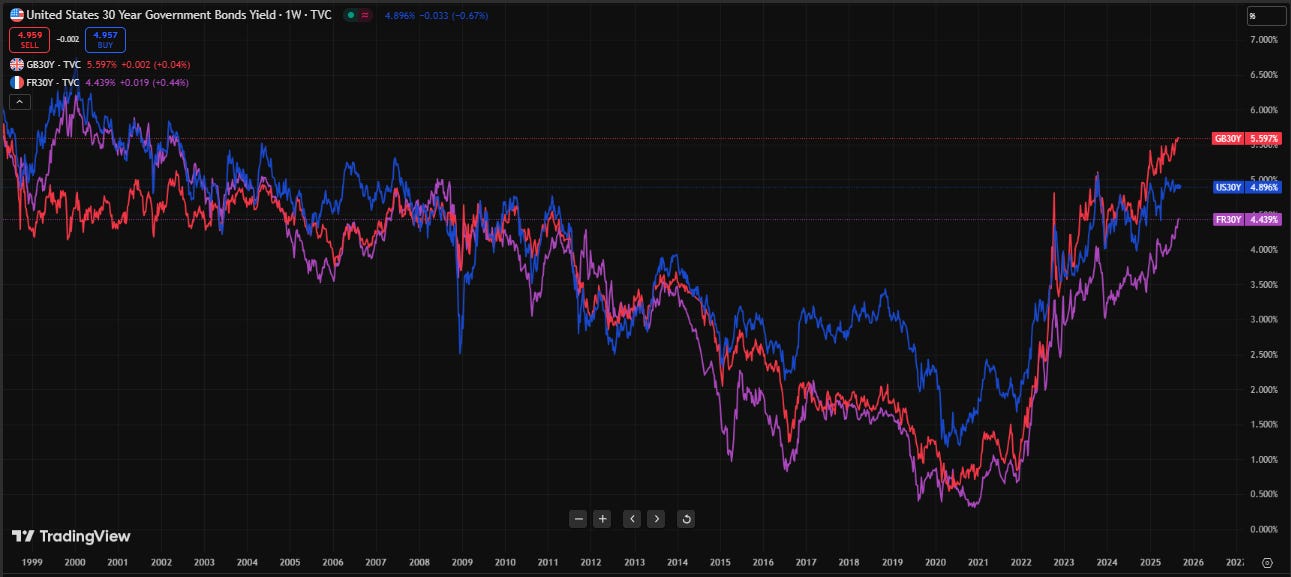
Figure 6 - 30 Year Bond Yields (US-blue; UK-red; FR-mauve); source: TradingView.com
After years of being duped, the bond market senses even higher approaching inflation and is selling-off.
The running price of gold and silver signals that physical demand is overwhelming the promissory note paper market carefully structured to hide their unwelcome comments on monetary policy.
Gold And Silver
Decades of declining real wealth for hourly workers with marginal wage increases while speculative bubbles drove asset prices higher and banks were bailed-out with gambling insurance by our central planners are now at an end.
Higher interest rates are now terminating the debt-fueled serial asset bubble economy operated during the prior period.
What we are seeing is not a failure of the market economy but the inevitable collapse of a structured fraud by our central banks and governments.
And gold and silver battered from decades of price manipulation remain, as always, ready to speak their truth.
And they will speak.
Best regards,
David Jensen

Once again, David, you have summed up the situation with precision. I cannot understand how intelligent people that I explain this to, cannot/will not see it.
And it is our.."enemies"..that are calling the bluff.....= more war to hide the total incompentense...
Tables are turning....Soon it will be, the "newly rich" tourists of the south that have real wealth
and the west having the Lira, Euro, dollaro...
So..WHO...owns the Euro bonds/gilts/UST, that are about to get RE-rated...?
YOUR pensions consist of approx..60 % BONDS.....and NO gold