


Near Breaking: Sustained Silver Market Metal Shortage Is Visible In Lease Rate Patterns Compared to Historic Rates And Patterns
Available Global Silver Stockpiles Are Bled Down

Studying market lease rates of gold and silver is valuable as it gives the price to secure physical metal in the London and NY COMEX gold and silver exchanges.
When an immediate ownership cash market such as the gold and silver spot market in the City of London has been constructed to trade and create claims for infinite amounts of gold and silver cash/spot promissory notes, the availability of such lease data to give insight into physical market conditions is an anomaly.
On January 30, 2015, the London Bullion Market Association (LBMA) stopped publishing Gold Forward (GOFO) and Silver Forward (SIFO) data from which the general lease rates in London could easily be calculated.
Today, what used to be commonly available from numerous sources on the web is maintained within bullion banks and trading houses. It is not for public consumption.
However, an ‘implied lease rate’ can be derived and calculated from futures market data as an approximation of market availability of silver and gold to the market and is provided through the valuable work of Nick Laird at GoldChartsRUs.com.
The various lease periods, or tenors, give an estimate of the cost to borrow gold and silver to deliver on these paper contracts on rare occasions where delivery is demanded by the contract holders and we can see a phase shift in the market over time as physical metal has become more scarce.
London Historic Lease Rate Patterns
From the LBMA’s trade paper The Alchemist Issue #29 December 2002, we can see the London gold lease rate (per annum) for 1-month and 1-year lease tenors from 1993 through 2002.
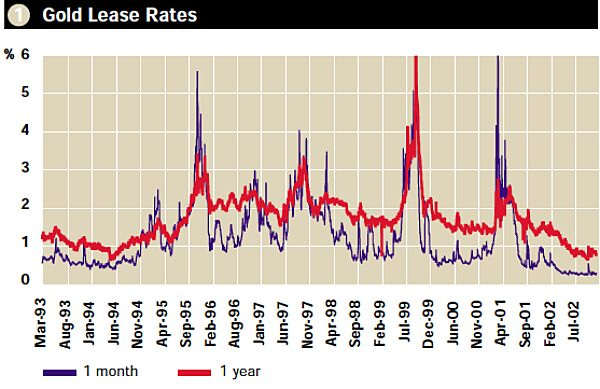
Figure 1 - London Gold Lease Rate 1993 to 2002; source: Issue #29 December 2002 The Alchemist - LBMA
Of note is that during this period in time the cost to lease / borrow gold for a 1-month period (purple line) was generally less than the cost of leasing for 1-year (red line). This makes sense as it reflects reduced risk premia and greater availability of gold to market for shorter periods allowing the metal borrower to presumably secure purchase of gold from other sources.
When traders are required to make physical delivery, they generally like to borrow gold and silver for as short a period as possible to minimize their costs of delivering metal on their contracts when this is required.
Silver And Gold Markets Can Become Disorderly
Figure 1 also shows the 1-month gold lease rate occasionally spiking above the 1-year lease rate during relatively short periods of market shortage of physical gold to market participants.
However, note in Figure 2 below that for the last 3 years the implied market lease rate for silver has maintained an inversion of this historic pattern with short term lease rates being higher than longer term lease rates. This is during a time of metal shortage where global silver vault stockpiles have been drawn-down by more than 500 million (M) oz. to meet market demand.
One signal from this inversion of historic lease rates is that physical silver bars are not as available to the market as financial market commentators have told us. As discussed previously, only a small fraction of the silver vaulted in London is available to market for sale (or increasingly, for lease).
Also, because silver is relatively bulky to store in terms of its value to its volume, silver’s implied lease rates have often been negative or near zero over long periods.
That has not been the case since 2022 - a signal further supporting the secular silver market liquidity shortage thesis.
In mid-2022, silver’s digital market price was as low as USD $18 /oz. while silver is now $30 /oz.

Figure 2 - Silver Implied Lease Rate - 17 Year Chart; source: GoldChartsRUs.com
Gold is showing an implied lease rate inversion similar to silver indicating a market that is not flush with physical bars either.
Keep in mind, that there are large gold holdings in official/government stockpiles that have (and are) being lent into the London market coordinated by the Bank of England.
There are no large stockpiles of silver in official reserve holdings that are readily available in-size to infuse markets.
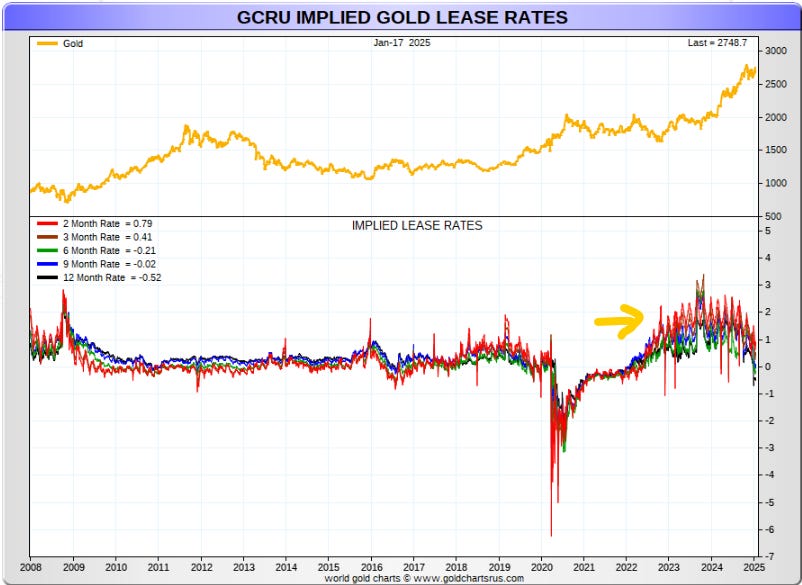
Figure 3 - Gold Implied Lease Rate - 17 Year Chart; source: GoldChartsRUs.com
The continual 6 year long drum-beat of global silver supply deficits continues this year and the static silver vault stocks in London combined with a sustained high silver implied lease rate together tell us something.
The 4B to 6B oz. short position in London’s cash silver market will not be sustainable as the global silver shortage continues.
Best regards,
David Jensen

Excellent work
Do you think a force majure is coming soon? I hope these criminals are called on the carpet soon.