


The Third Monetary Metal is Breaking Out
And A Look at its Correlation to Silver

Most know that gold and silver have been monetary metals for thousands of years. Fewer are aware that there is a third metal that has been a monetary metal for millennia as well - copper.
As we observe now the consequences of fiat currency debasement on a daily basis, copper as well as silver and gold is worthy of review as an asset.
Supply and Demand
China’s smelters produce 45% of the global supply of copper and these smelters have seen a decline in expected output from global copper mines in 2024. As a result, the global copper market outlook has gone from an expected surplus in 2024 just a few months ago to now a metal deficit this year.
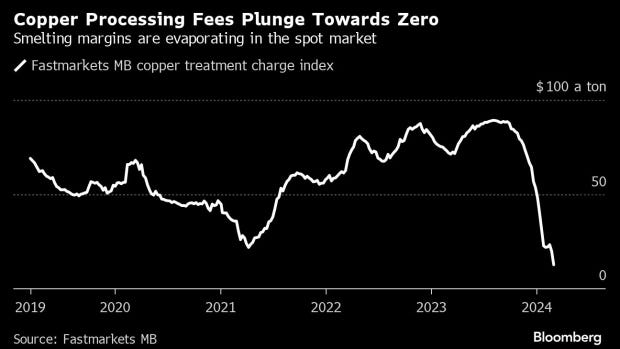
A slowdown in copper concentrate supply from mines has already resulted in fierce competition by Chinese copper smelters to the point the smelter fees have dropped from $90 /ton to just $12 /ton over the past 6 months.
Tightening supply of copper concentrate has been matched by tightening refined copper supply at the New York and London exchanges. The London Metal Exchange (LME), with the world’s largest exchange warehouse holdings for copper, has seen a continuous steady decline in cyclical peak copper inventories with the current warehouse decline being now accompanied by a break upward in the copper price action.

Chart source: www.westmetall.com
Copper Price Action and Its Relation to Silver
When looking at metal prices it must be kept in mind that, since the late 1980s, exchange prices for metals in London and New York have been set utilizing promissory note (paper) trading that attenuate the price discovery of metals on the exchanges and have resulted in artificially low prices during this period.
All such market price distortion mechanisms ultimately result in metal shortage and, when sufficient metal shortage occurs, the paper trading system fails as bullion banks and metal traders cannot sell promissory notes for metal without facing default when metal delivery, for metal that they do not hold, is demanded. A decline in metal contract trading can suddenly occur as the true supply/demand balance of the market is revealed.
Looking at this comparative price chart for copper and silver over the past 24 years, two general observations can be made:
The copper (orange line) and silver (grey) price action generally correlates over time;
Recently, the price action correlation between the two metals has become tighter.
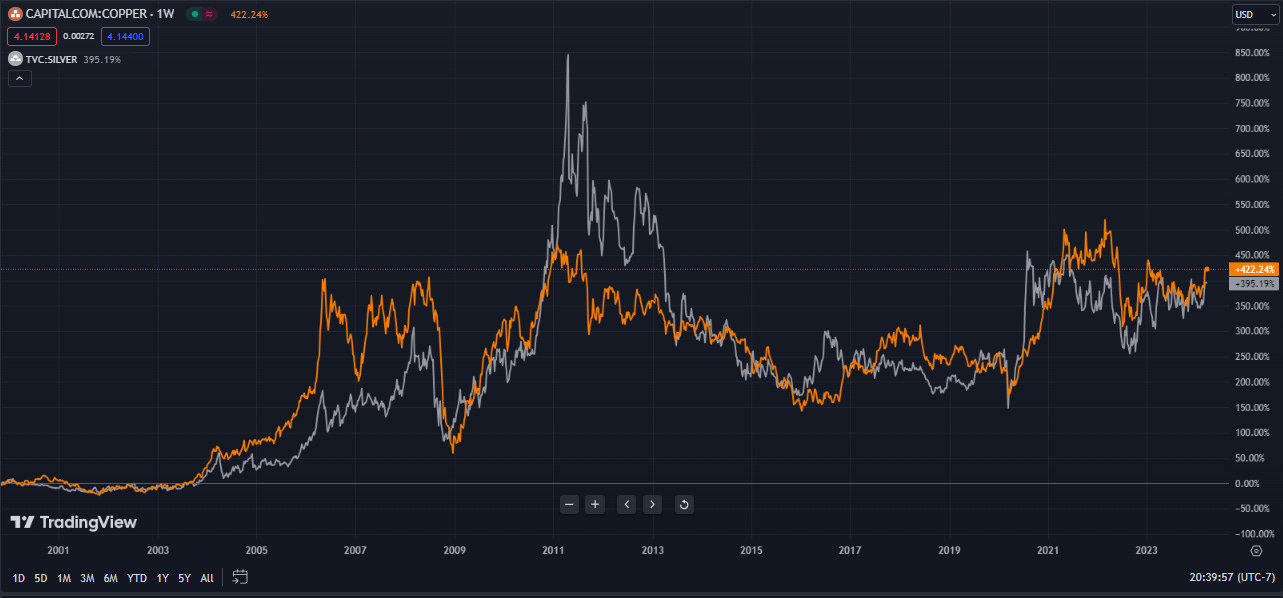
Looking at this 5 year chart of copper and silver, the tightening correlation can further be seen as well as the fact that copper now appears to be breaking out of a classic flag price consolidation pattern.

The tightening correlation between these two monetary metals is interesting but not unexpected as stockpiling and increasing shortage of both metals would be expected to occur as monetary debasement becomes widely visible and citizens begin to hedge their loss of buying power from holding currency thereby amplifying any prior shortage of metal in the market.
Both copper and silver are now well known to be in physical shortage in the market and setting prices with promissory note algorithmic trading becomes increasingly difficult in such a physical shortage situation. A price reset as such an entrenched trading system fails can be spectacular as a return to supply demand dynamics and balancing of the market occurs.
It will be interesting to see if the copper price break-out continues and if silver then follows its lead.
Best regards,
David Jensen